Graphics
Data visualization, Programming, Scrollytelling and Design Projects
Click any of the links below to see more.
R Graphics
Swipe left or right to see more
These charts were created by analyzing the data using RStudio and then using R to produce a variety of charts suitable for presenting the data. The charting process utilized R packages such as ggplot, echarts4r, and others.
| Tools:
RStudio, Adobe Illustrator
Datawrapper Graphics
Swipe left or right to see more
The interactive data graphics generated by Datawrapper leverage the capabilities of HTML and CSS to enhance their visual appeal and overall impact.
| Tools:
Datawrapper, HTML, CSS
D3 Interactive Visualizations
Swipe left or right to see more
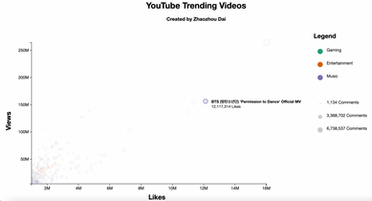
These interactive charts were developed utilizing D3.js in JavaScript, with accompanying HTML and CSS modifications. By clicking on the images, you can find live links that allow for further exploration and interaction with the charts.
| Tools:
HTML & CSS, JavaScript, D3.js
Analysis of demographic characteristics of immigrants and characteristics of foreign-born labors >>>
This project aims to examine the percentage of immigrants and foreign-born individuals residing in the United States between the years 2010 and 2020, using datasets provided by the U.S. Department of Homeland Security and the U.S. Bureau of Labor Statistics.
For this project, Python is utilized to transform unrefined data into a pristine dataset, after which Python is used for data analysis and visualizations.
| Tools:
Python, Google Sheets/Excel, Adobe Illustrator
This is a dashboard of the latest FDA recalls, using Leaflet.js to create a map and D3 to manipulate the DOM.
This project works by pinging the FDA recalls API, which is updated whenever an update is made to any report.
| Tools:
HTML & CSS, API, JavaScript, LeafletJS
Interactive website about the diversity of dumplings in Chinese cuisine.
| Tools:
HTML & CSS, JavaScript, LeafletJS,
Flickity, Adobe Photoshop
This interactive project is to discover and explore the 2022 world's leading academic institutions—the dataset acquired by scraping the QS World University Rankings website with Python and Selenium.
| Tools:
HTML & CSS, D3.js, JavaScript, RStudio, Google Sheets/Excel


